REACH
Reach will inform you about the number of potential contacts with the media message. This indicator is developed on the basis of the average number of views of online materials, taking into account exposure rate of proprietary names in content and organic reach of social media channels.
Reach of websites reflets the number of potential contacts with the material. The value of a single publication is the product of the average monthly number of domain views and the coefficient of exposure of proper names in the content. Materials on the homepage generate higher average of page views, so the final number of contacts with their message is always higher compared to other articles of the website.
Social media reach refers to the number of unique, active and engaged users who had the opportunity to see and read a published post.

AVE
Advertising equivalent (AVE) is an indicator that will help you assess the effectiveness of your PR activities and estimate the amount that should be spent on the publication or emission of a given message if it was an advertisement. The advertising equivalent (AVE) expresses the monetary value of publications from a given medium. The indicator is estimated by comparing the monitored information with the advertising cost of material of the same area.
AVE on the Internet reflects the amount of money that would have to be spent on a publication in a portal or social media if it were published as part of an advertising service. The indicator is calculated on the basis of price lists of articles on native or sponsored portals with general and specialized profiles, as well as the average cost of sponsored publications in social media. The AVE value of a homepage material is always higher compared to other articles due to differences in advertising price lists.
AVE in social media reflects the amount of money that would have to be spent on posting a selected message if it were an advertisement.

POWER INDEX
With the Power Index, you can measure the power of a media message in the audience in the scale of 0-10, where 0-5 indicates „potential for growth,” 6-8 „effective impact,” and 9-10 „strong impact.” The score on the scale is the resultant of the most important parameters of the publication: impact, reach, source profile, number of keywords, their place of occurrence in the material, scale of exposure and opinion-forming based on IMM’s annual report „The most opinion-forming media in Poland”. It applies to every media publication monitored by IMM, including the most important social networks: Facebook, X (Twitter), Instagram, YouTube and LinkedIn.

OVERTONE OF PUBLICATIONS
Would you like to control what the people say about you in the media? Pay attention to the overtones of the monitored publications in terms of potential impact on your brand image. NewsPoint’s algorithm distinguishes materials that are:
Positive, in which positive descriptions prevail for a given product/service/company/person, e.g. the best, outstanding, very good, fast, impressive, or charity, sponsorship, patronage of culture, good financial results, etc.
Neutral, in which the value terms are usually absent, and only the informative content is visible in the text.
Negative, in which terms that evaluate the product/service/company/person in a negative way prevail, e.g. defective, ugly, bad, dishonest, harmful, weak, and there are often pejorative nouns, such as: monopolist, thief, cheater, liar, etc.

SATURATION
The index of saturation with keywords shows how often a given media message mentions your brand, keyword or issue in the form of text, video or audio. Low saturation (low) occurs when one keyword is noted in the material, medium saturation (medium) stands for two keywords and high saturation (high) – three phrases. Very high saturation (extensive) defines a material with the number of keyword phrases equal to 4 and more.

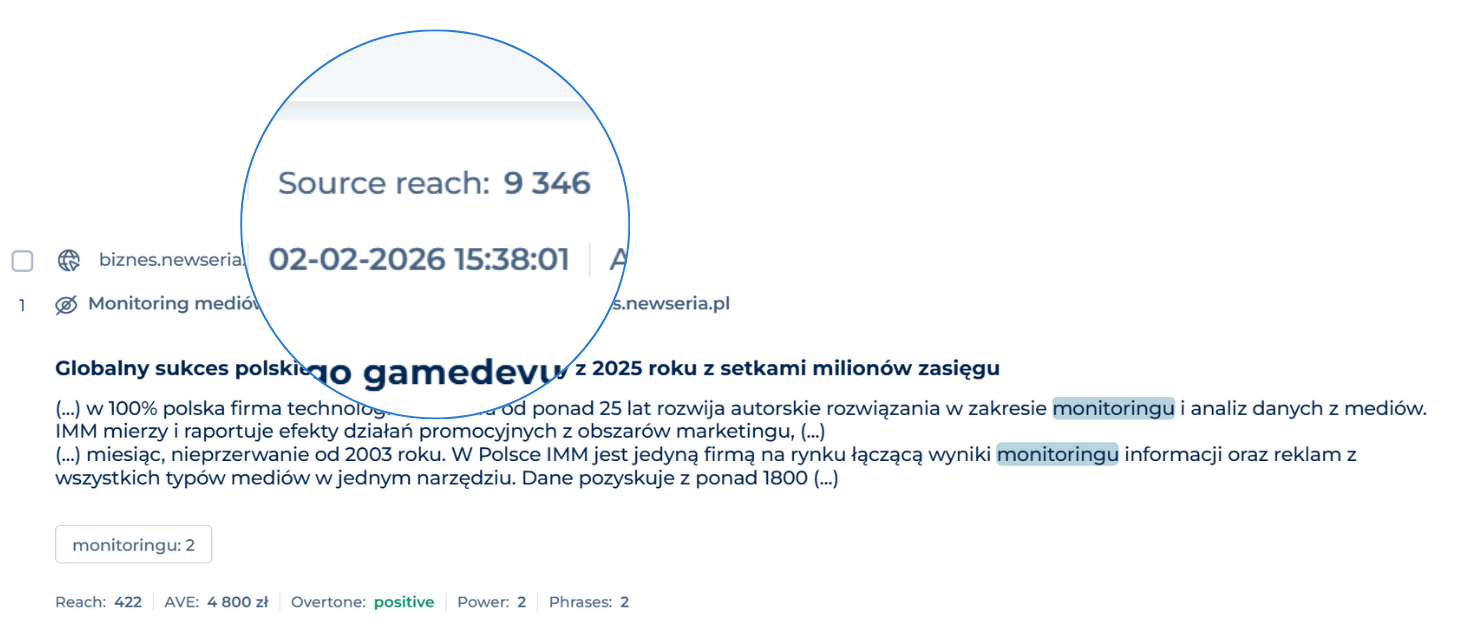
SOURCE REACH
An indicator showing the potential number of recipients of a given source. It refers to the entire press title, internet portal, radio or television station, and social media profile/page. It is based on data on readership or circulation of a press title, average viewership/listenership of radio and television media, taking into account the subject matter and broadcast time, average monthly number of unique users of an internet portal, and in the case of social media, the number of fans of a given channel/profile.
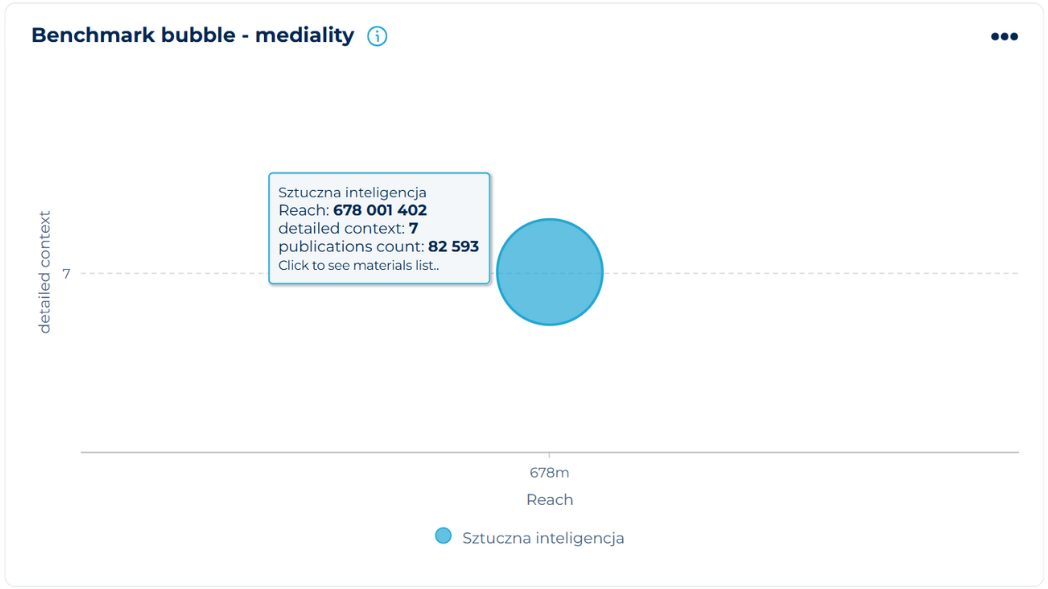
BENCHMARKING
Benchmarking map stands for the media strength of a brand against its competitors. Mediality is examined in three dimensions: reach, number of publications and the image context value (percentage of positive publications in the whole discussion about a brand). The most favorable point for a brand on the graph is the upper right corner and a bubble larger than competing bubbles. The size of the bubble indicates the number of publications (the larger the bubble, the more media mentions the brand has recorded). The up-down direction (Y axis) indicates the value of image context – the higher the brand is, the more positive publications have appeared about it. The right-left direction (X axis), is the scale of coverage. The brand positioned on the right side of the graph reached a wider audience with its messages than the brand shown on the left side of the graph.
OPINION-FORMING SOURCES
The IMM’s author report „The most opinion-forming media in Poland” is developed on the basis of the analysis of the monitoring result from press, radio, television and Internet portals, which mentioned the names of:
- Press titles;
- Radio stations, TV stations or titles of their programmes;
- Internet portals or titles of their programmes.
The study also takes into account press titles distributed exclusively as e-publications (pdf downloadable from the website), which, despite the change in the form of distribution, have not abandoned their current publication frequency, such as weekly Wprost.
The analysis includes all the media messages referring to articles, announcements and statements that were originally published or broadcast by other medium. More than 1,100 newspapers and magazines, selected programs on TV stations (TVP1, TVP2, TVP Info, TVN, TVN24, TVN24BiS, TVN Turbo, Polsat, Polsat News, Polsat News 2) and radio stations (PR1, PR3, PR4, RDC, Radio Maryja, RMF FM, Radio Zet, TOK FM and Eska ROCK) are taken into account, as well as the Internet portals where the new content appears regularly. The report does not include materials from social media channels and comments posted under articles on online portals.