Below you will find instructions on how to generate them.
- Go to the Statistics tab in the Main Menu
- A form consisting of two tabs will appear on the screen
- To generate one-time statistics for a given period of time and selected media, go to Generate Now tab. If you want to generate statistics periodically at specified intervals, select the Generate Periodically tab.
- The generated statistics will appear in the “Special Materials” folder below the project tree. The processing time depends on the number of materials and may take up to several minutes. Generating the report does not interfere with other work on the Platform.
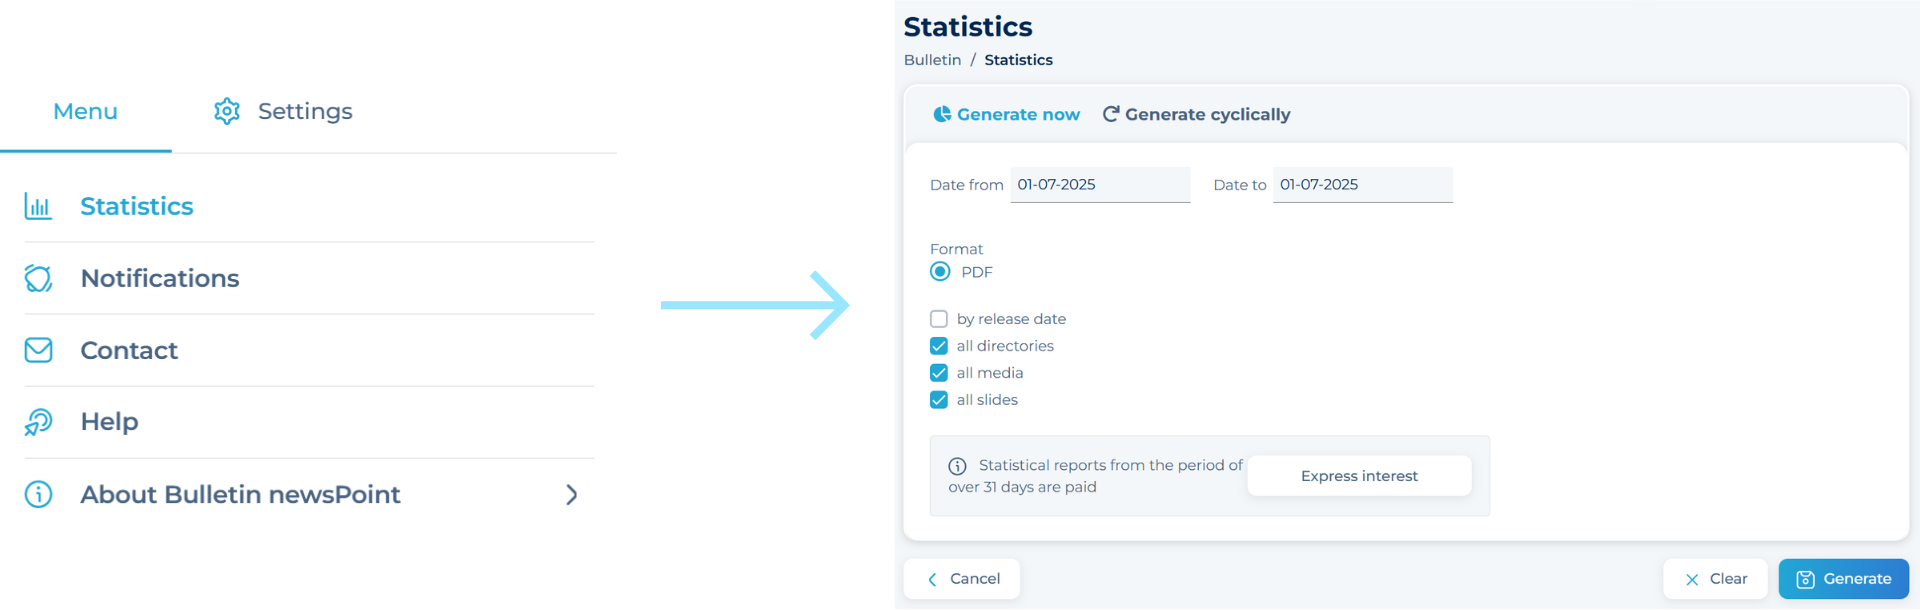
“Generate now”
Select the dates for the period from which the document will be created. Then select the file format (PDF) in which you want to save the statistics. Next, you need to select at least one medium from the project tree. If you want statistics from all projects, select all folders. Below the folder selection, there is an area to choose the types of media to include in the report. You must select at least one medium. The next element of the form is the selection of slides (charts and tables). If you have entered all the data, click the Generate button at the very bottom.
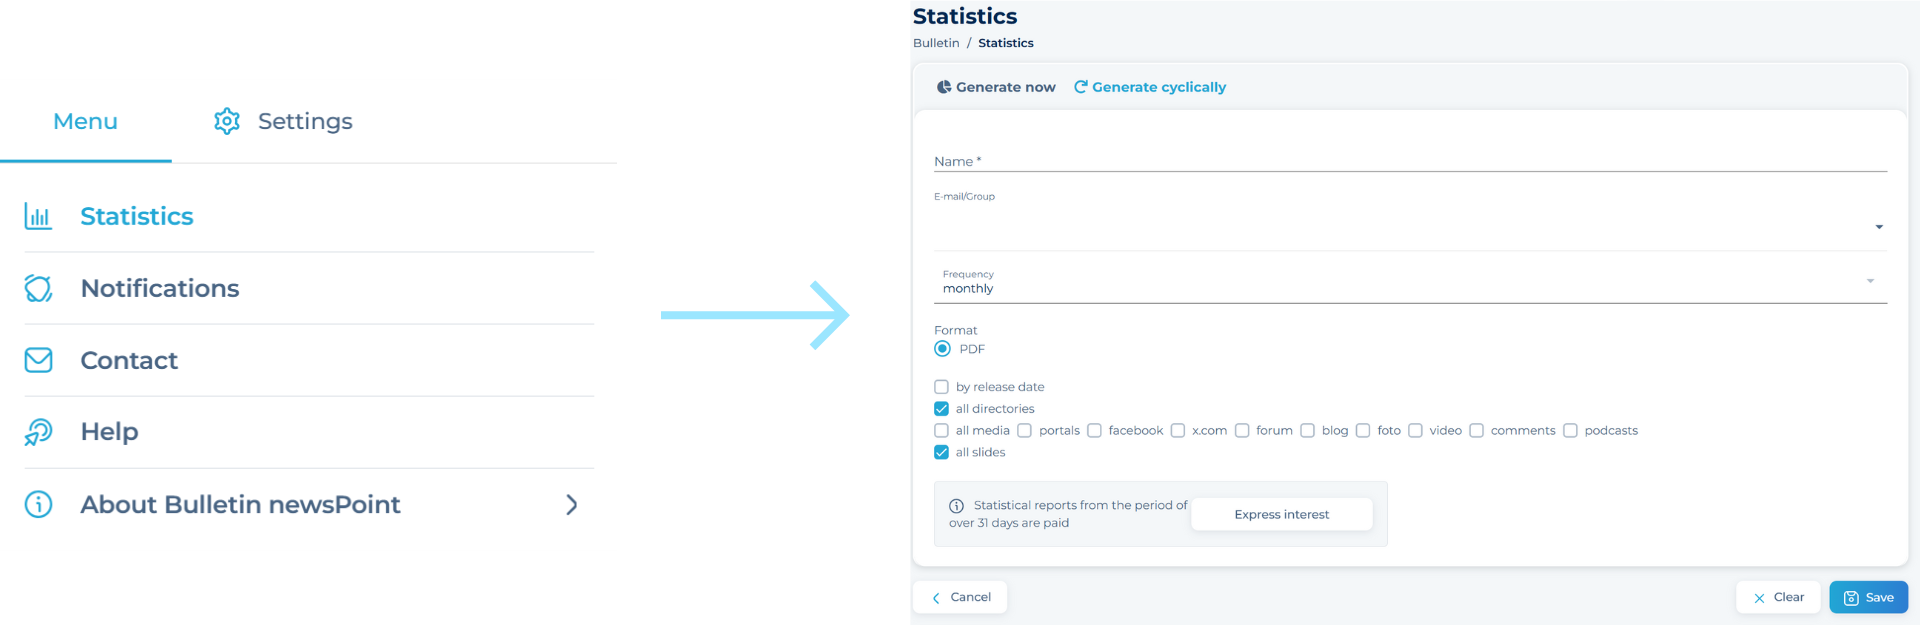
„Generate cyclically”
To generate statistics at a specified frequency, use the second tab – Generate Periodically.Then fill in the Name field, which will be displayed in the list of statistics generated periodically, and enter the e-mail address to which we will send cyclical reports. Now specify the frequency of receiving the reports (weekly, monthly, every two, three, six, or twelve months). Next, select the file format (PDF) in which the statistics are to be saved. Below the selection of dates, there is a place to select the criteria from which the report is to be created (the same fields as in the Generate Now option). If all data have been entered, save the changes.
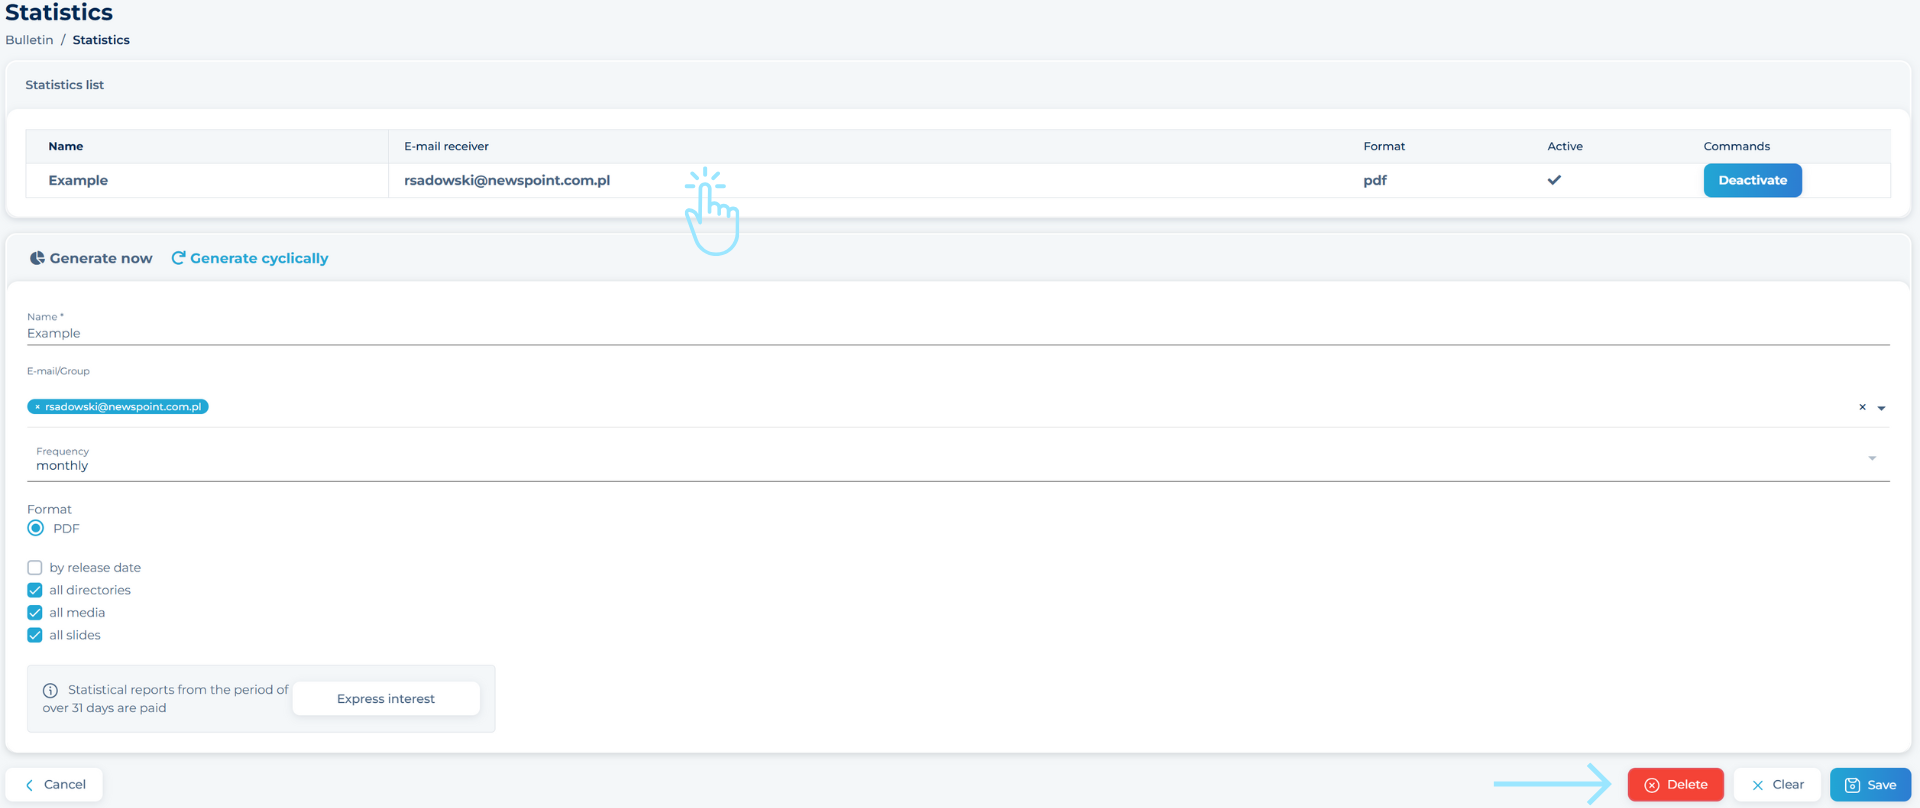
Edit „Generate cyclically”
Go to Statistics and select the report from the Generate Periodically tab that you want to edit, then click on its name and change the data in the form below.
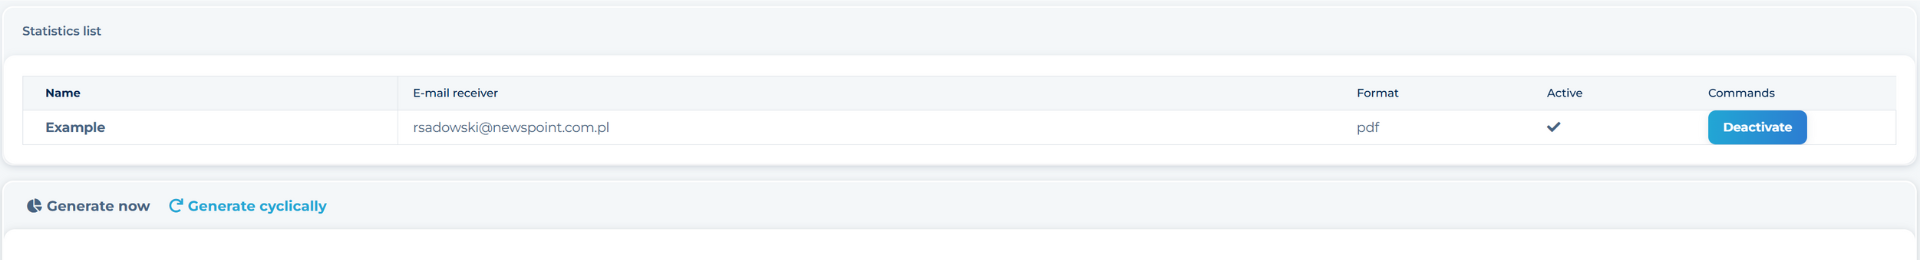
DEACTIVATING ,,Generate Periodically”
To deactivate recurring statistics, click the Deactivate button located to the right of the given name.
Delate „Generate cyclically”
Select the report from the list to be deleted, following the instructions in EDIT Generate Periodically. Then click the red delete button at the very bottom of the form.
Statistics over 45 days are chargeable. If you select a date range longer than 45 days, the system will generate a quote, which will appear in a new overlay window.