New, clear layout of the most important information about the monitored material, along with identification of graphics, makes it easy to quickly read the message.
Setting the method of presentation
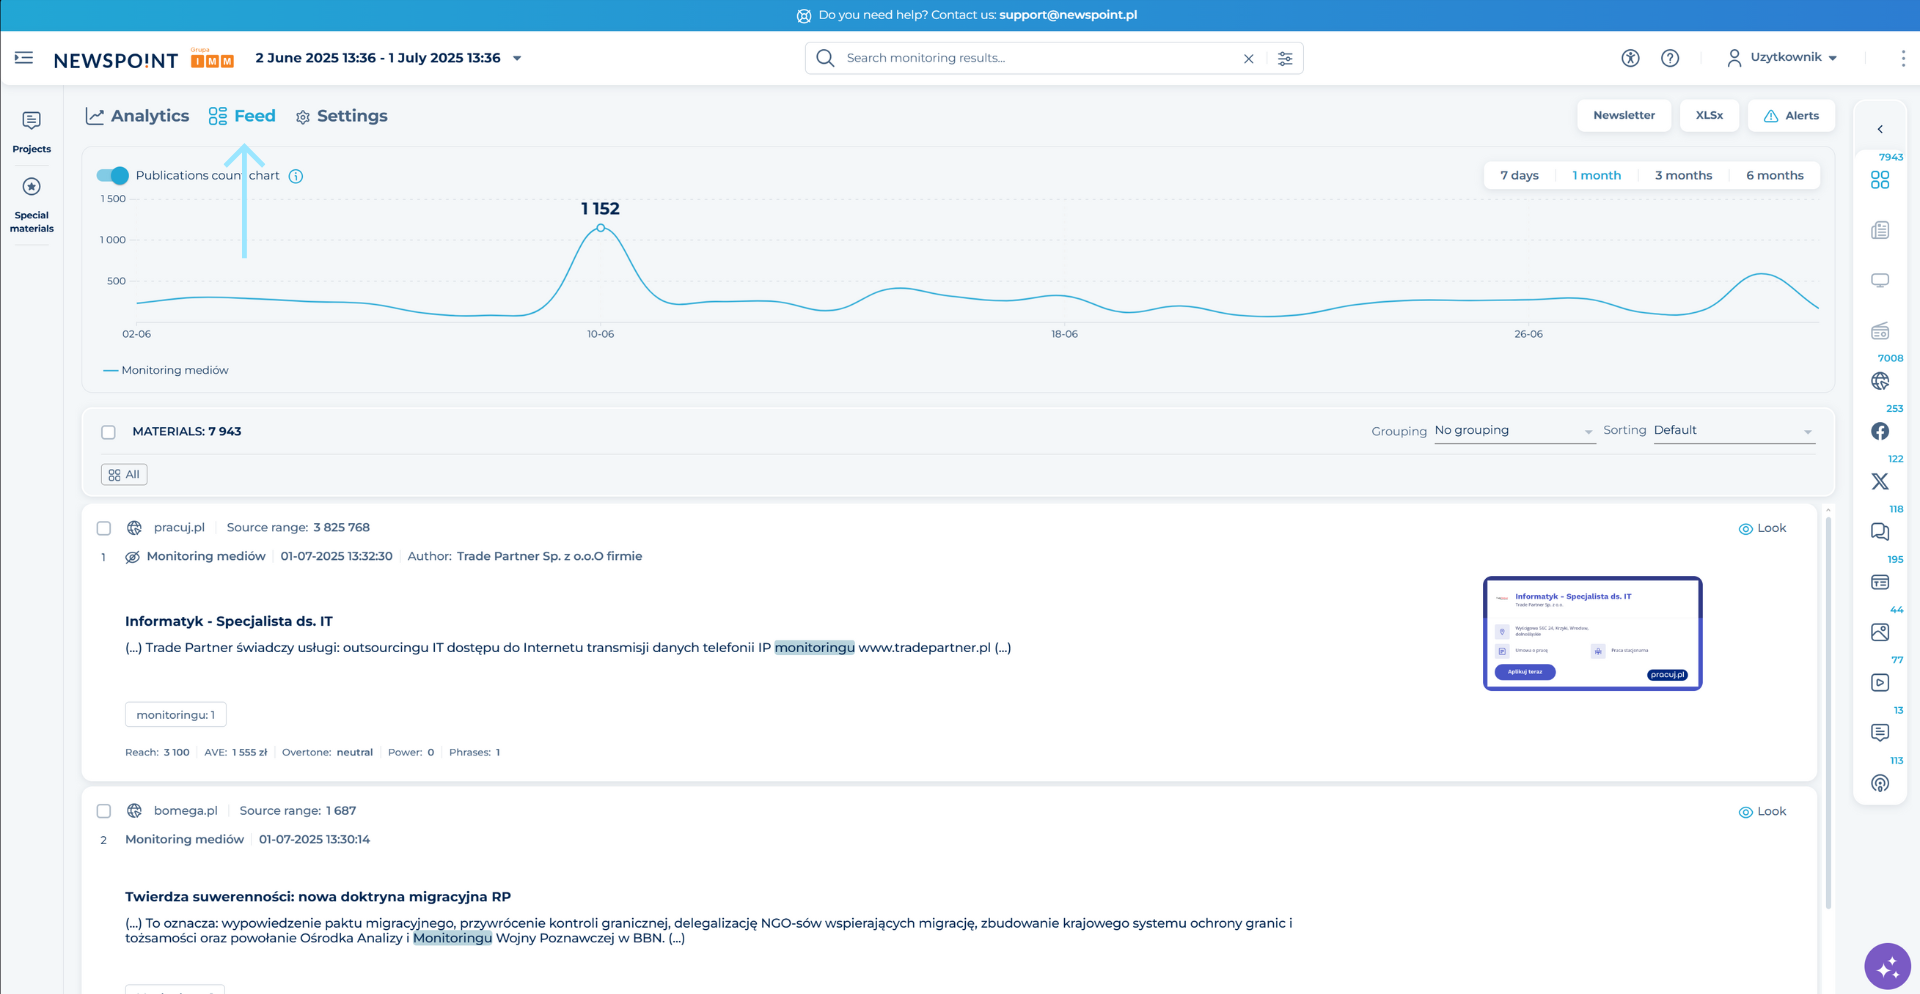
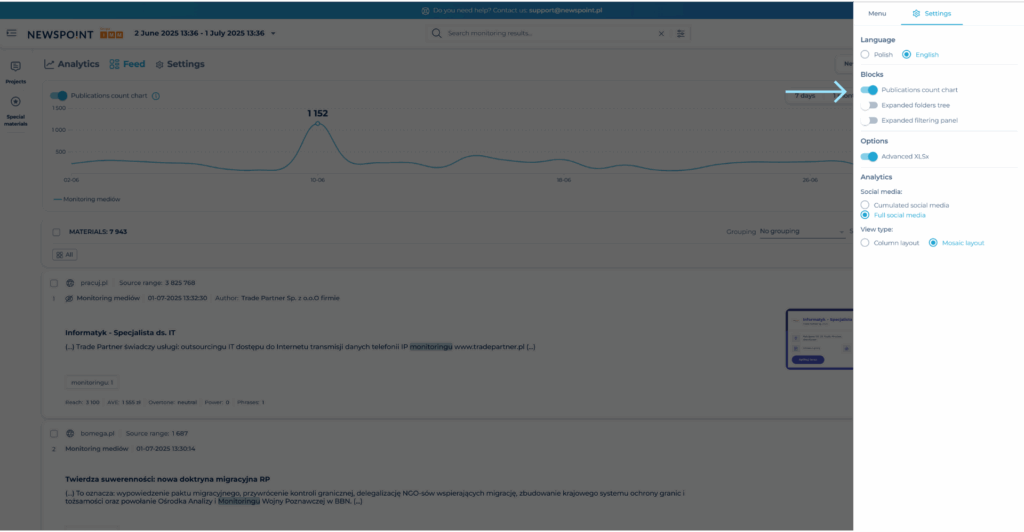
Go into the Settings, which are available in the Main Menu. Then select “Feed” as the chosen method of the materials presentation.
INTERACTIVE CHART
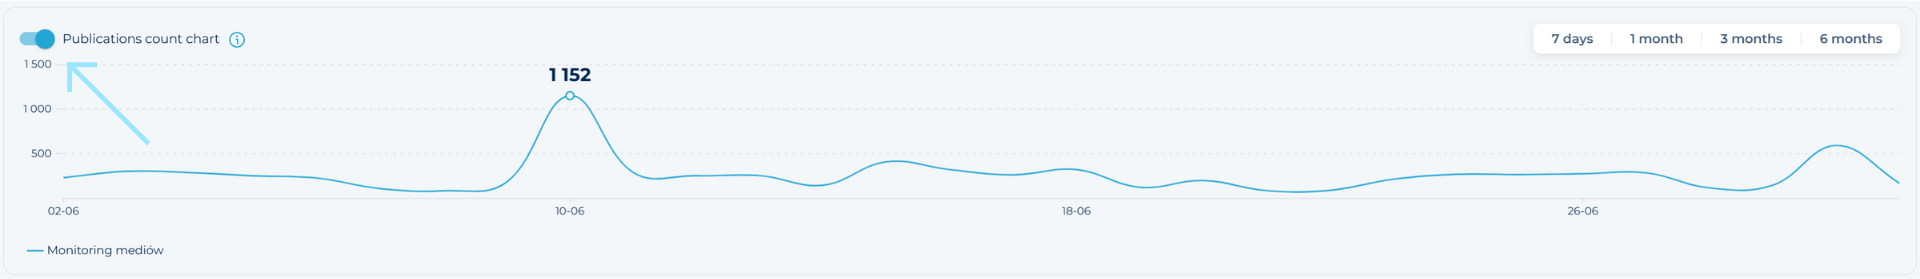
The chart will allow you to compare the number of projects publications (max. the first five in the list) on a timeline from one, three or six months. In addition, you have the option to check the publication peaks with the cursor and display the corresponding materials on the feed. To work on the chart, go into Settings, which you will find in the Main Menu. Then in the blocks section, activate the publications count chart.
You can hide the chart at any time using the blue switch above the chart.
How to access the selected material from the Feed level?
If you want to see the material from the Platform (Bulletin) level in a new tab of the browser, click on the title of the material.
You can also use the „View” function, which is available under each material, in the upper right-hand corner of the publication window.
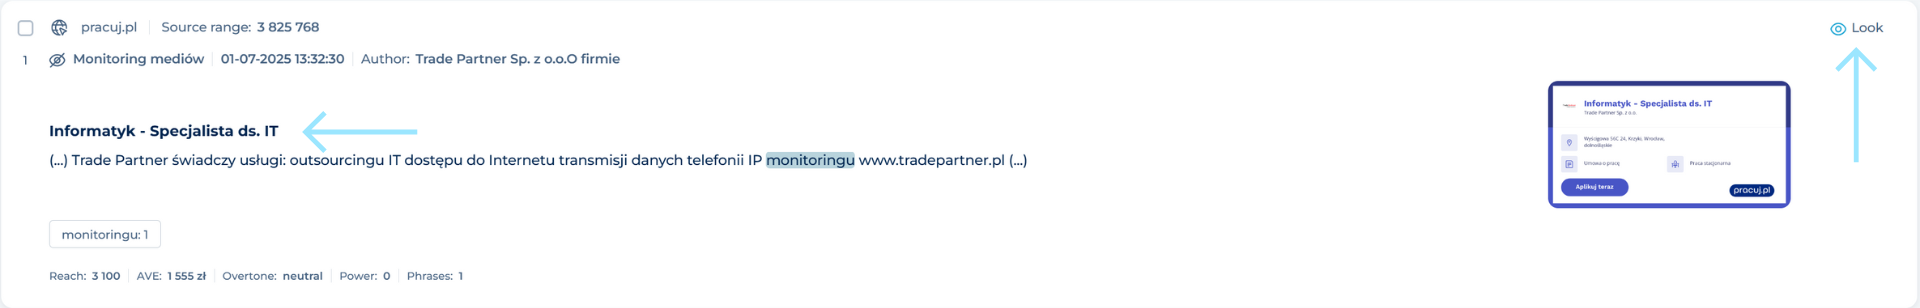
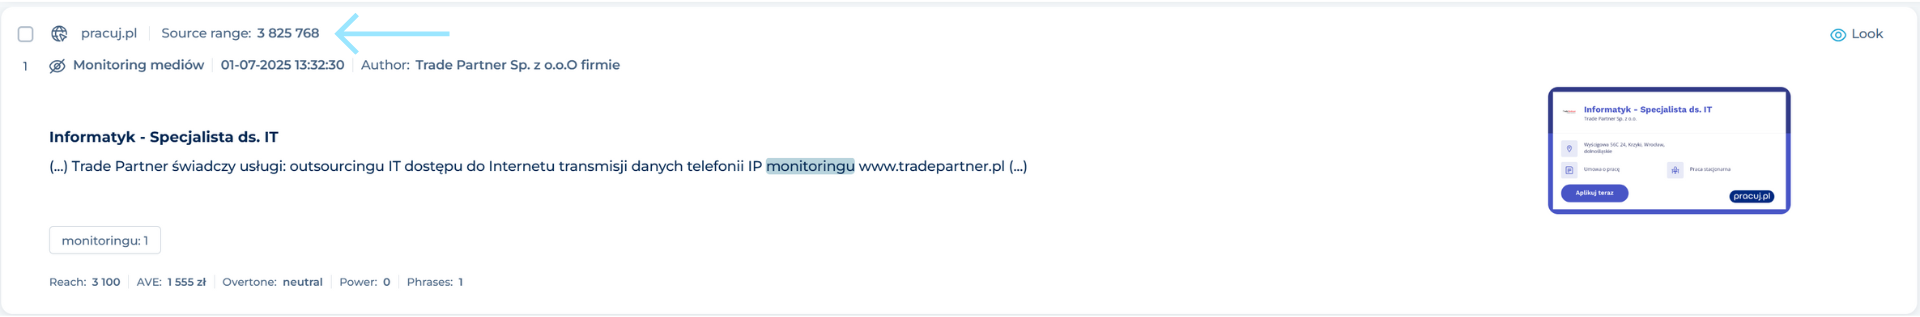
Do you need to redirect to the source of the material in a new tab? Click the source of the material, which is located in the upper left corned of the publication window.